Ship Without Fire Drills: Canary, Blue-Green, and Rolling Deploys
By Skyhook Team
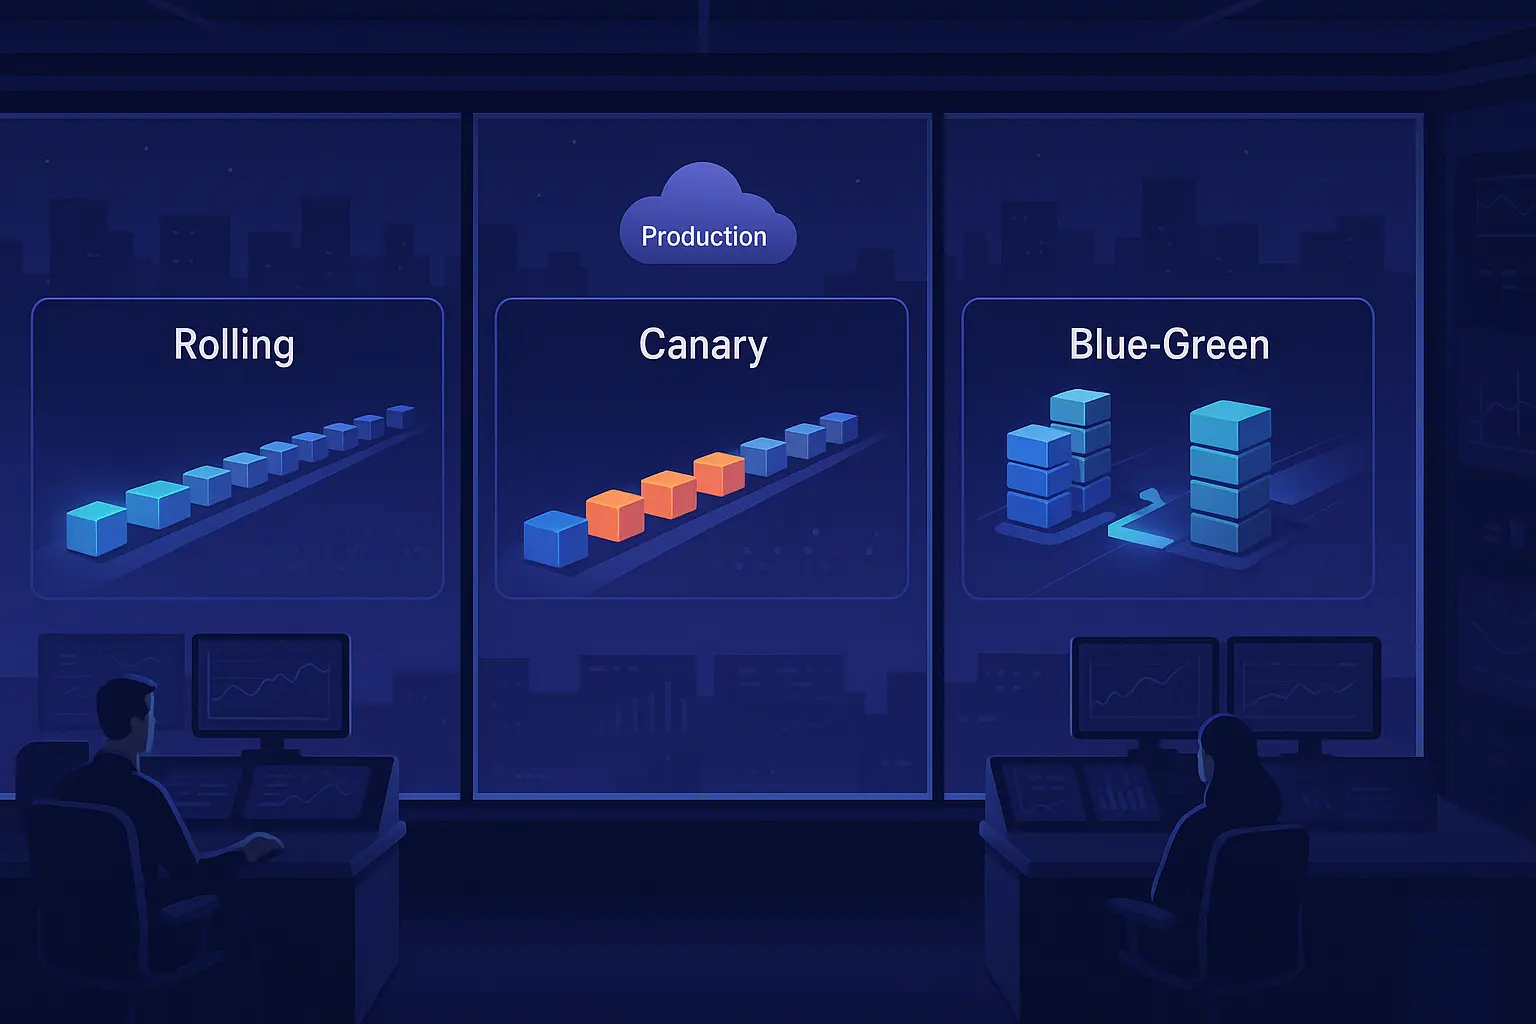
TL;DR: Shipping to production is easy; shipping safely is hard. Progressive delivery strategies - Rolling (Gradual), Canary, and Blue-Green - constrain blast radius, create decision points, and give you measurable guardrails. This post explains why they matter, how each works, pros/cons, failure modes, and the key knobs you can tune. We also include concrete YAML snippets you can lift into your pipelines. At the end, we show how Skyhook.io integrates Argo Rollouts so teams can do this with a click.
Why Progressive Delivery Matters
When a release goes wrong, you don't want a binary "all or nothing" deployment. You want narrow exposure, fast feedback, and emergency brakes.
Case in point: the CrowdStrike Falcon content update (July 2024). This incident shipped a flawed sensor configuration that triggered Windows BSODs (Blue Screen of Death) at a global scale. A single binary push affected millions of systems in minutes. The actionable lesson for application teams is to deploy progressively with circuit breakers: small initial exposure, metric-gated promotion, and instant rollback. Had CrowdStrike used canary deployment with a 5% traffic gate, the blast radius would have been contained to thousands of systems, and rollback would have been automatic within minutes.
This kind of failure is increasingly common because modern systems have high dependency density: kernel/OS, base images, libraries, feature flags, infra add-ons, and your app. Any one of those can fail in a way that is:
- Correctness-breaking (logic/compatibility/API mismatches)
- Performance-degrading (p99 latency regressions, garbage collection (GC) or heap thrash, I/O contention)
- Safety-critical (authorization bypass, data loss, cascading retries)
Progressive delivery strategies reduce mean time to detect (MTTD) from hours to minutes and limit blast radius by introducing staged exposure and automated rollback based on real traffic signals. Studies show this approach reduces incident severity by roughly 70% and cuts incident response time from hours to minutes.
Strategy 1: Rolling (Gradual) Updates
Idea: Replace pods incrementally while keeping the service endpoint stable. New pods come up; old pods drain; traffic shifts implicitly as endpoints register or deregister.
How it works (Kubernetes Deployment):
- maxSurge: how many extra pods you can add above desired during rollout
- maxUnavailable: how many of the old pods can be down during the update
- Readiness/liveness/startup probes gate traffic
When to use:
- Backward-compatible changes where schema, config, and protocol compatibility is guaranteed
- You don't need explicit traffic splitting; implicit load balancing is fine
- Frequent, low-risk releases (e.g., configuration tuning, documentation updates)
Pros:
- Simple, native to Kubernetes; no extra controllers or custom resource definitions
- Good for low-risk, frequent changes
- Minimal cluster overhead
Cons:
- No explicit step-wise traffic weights, so harder to pause, measure, and abort at controlled percentages
- Rollback is another rollout; may not be instant if capacity is tight. If maxUnavailable=0, rollback takes just as long as the forward rollout.
- No built-in metric gates; relies entirely on liveness/readiness probes
Key knobs:
- maxSurge, maxUnavailable
- Probe thresholds (failureThreshold, periodSeconds)
- minReadySeconds (grace period before pod is considered ready)
- Pod Disruption Budgets (PDB) to guard availability
Example (native Kubernetes Rolling):
apiVersion: apps/v1
kind: Deployment
metadata:
  name: api
spec:
  replicas: 12
  strategy:
    type: RollingUpdate
    rollingUpdate:
      maxSurge: 25%
      maxUnavailable: 0
  template:
    spec:
      containers:
        - name: api
          image: ghcr.io/org/api:v1.9.0
          readinessProbe:
            httpGet: { path: /healthz, port: 8080 }
            periodSeconds: 5
            failureThreshold: 3
          livenessProbe:
            httpGet: { path: /livez, port: 8080 }
            periodSeconds: 10
            failureThreshold: 2
Strategy 2: Canary Releases
Idea: Shift a small, explicit percentage of production traffic to the new version, analyze service-level objectives (SLOs) and metrics, then progressively increase if healthy (or auto-rollback if not).
How it works (Argo Rollouts):
- Controller replaces Deployment with Rollout and orchestrates traffic steps
- Integrates with service meshes or ingress controllers (Nginx, AWS Application Load Balancer (ALB), Istio, Linkerd, etc.) to apply precise traffic weights at the ingress layer
- Analysis templates execute asynchronously during pauses, querying Prometheus, Datadog, Kayenta, or webhooks
- If any metric breaches its failure threshold, the rollout aborts automatically and rolls back
Important: Canary requires traffic splitting at the ingress or mesh layer. It will not work with bare Kubernetes Service load balancing, which always distributes traffic evenly across all pods.
When to use:
- Medium or high-risk changes: library upgrades, infra changes, or anything touching critical paths
- New feature rollouts where you want to measure real user impact before going wide
- Changes with low backward compatibility confidence
Pros:
- Precise traffic control (e.g., 2% -> 10% -> 25% -> 50% -> 100%)
- Built-in pauses, automated analysis, and instant rollback on metric breach
- Reduces blast radius to a measurable percentage from the start
- Provides early signal on performance and correctness before wide rollout
Cons:
- Requires mesh or ingress controller integration and metric observability hygiene
- Slightly more control-plane complexity than Rolling
- Demands well-tuned SLO thresholds and metric lookback windows
Key knobs:
- Step weights and pause durations
- Max surge/unavailable for capacity safety
- Analysis templates: success/failure thresholds, metric lookback windows, failure limits
- Abort conditions and rollback strategies
Example (Argo Rollouts Canary with analysis):
apiVersion: argoproj.io/v1alpha1
kind: Rollout
metadata:
  name: checkout
spec:
  replicas: 10
  strategy:
    canary:
      canaryService: checkout-canary
      stableService: checkout-stable
      trafficRouting:
        nginx: {}
      steps:
        - setWeight: 5
        - pause: { duration: 120 }
        - analysis:
            templates:
              - templateName: slo-99-latency
            args:
              - name: service
                value: checkout
        - setWeight: 25
        - pause: { duration: 180 }
        - analysis:
            templates:
              - templateName: slo-99-latency
            args:
              - name: service
                value: checkout
        - setWeight: 50
        - pause: { duration: 300 }
      maxSurge: 2
      maxUnavailable: 0
  template:
    spec:
      containers:
        - name: app
          image: ghcr.io/org/checkout:v2.3.1
Example (AnalysisTemplate with 99th percentile latency and error rate):
apiVersion: argoproj.io/v1alpha1
kind: AnalysisTemplate
metadata:
  name: slo-99-latency
spec:
  metrics:
    - name: p99-latency
      interval: 30s
      successCondition: result < 400
      failureLimit: 1
      provider:
        prometheus:
          address: http://prometheus.monitoring:9090
          query: |
            histogram_quantile(0.99, sum(rate(http_request_duration_seconds_bucket{service=~"{{args.service}}"}[2m])) by (le)) * 1000
    - name: error-rate
      interval: 30s
      successCondition: result < 0.01
      failureLimit: 1
      provider:
        prometheus:
          address: http://prometheus.monitoring:9090
          query: |
            sum(rate(http_requests_total{service=~"{{args.service}}",code=~"5.."}[2m]))
            /
            sum(rate(http_requests_total{service=~"{{args.service}}"}[2m]))
    - name: user-checkout-success
      interval: 60s
      successCondition: result > 0.99
      failureLimit: 1
      provider:
        prometheus:
          address: http://prometheus.monitoring:9090
          query: |
            sum(rate(checkout_success_total{service=~"{{args.service}}"}[3m]))
            /
            sum(rate(checkout_attempts_total{service=~"{{args.service}}"}[3m]))
Analysis templates run asynchronously during each pause step. If a single metric fails (failureLimit: 1), the entire rollout aborts and triggers automatic rollback rather than waiting for all metrics to pass. This ensures fast feedback and prevents cascading user impact.
Note: A canary might show healthy latency metrics but still fail in production due to missing business logic checks. Always include user-journey SLOs (e.g., login success rate, checkout completion rate) alongside infrastructure metrics. Health illusions are one of the most common silent failures in rollouts.
Strategy 3: Blue-Green (also called Red-Black)
Idea: Run two full environments (Blue = live, Green = new). Validate Green behind the scenes; when ready, flip the router (or swap service labels) instantly. If it breaks, flip back.
How it works:
- Traffic is directed 100% to the Blue (stable) environment.
- The Green (new) environment is deployed alongside it, receiving no live traffic.
- Internal smoke tests, synthetic probes, and validation checks run against the Green environment's preview endpoint.
- When Green is confirmed healthy, the production router is "flipped" to send 100% of traffic to Green in a single atomic operation.
- Blue is kept warm for a short time to allow for an instant rollback if issues are detected in the first few minutes.
When to use:
- Protocol or compatibility changes that demand clean switchover (e.g., gRPC -> HTTP/2, database schema migrations)
- Releases requiring database migrations executed separately using the expand-migrate-contract pattern
- Changes with zero tolerance for partial state inconsistency
- When you need smoke tests or backfills to run before any user traffic arrives
Pros:
- Instant cutover and instant rollback (flip happens in milliseconds)
- Clean separation that enables exhaustive pre-flight validation
- No gradual traffic shift; users experience either Blue or Green, never a mixed state
- Excellent for coordinated infrastructure changes
Cons:
- Double capacity required during release (both environments run simultaneously)
- Requires careful state management: shared databases, caches, and session stores must be compatible with dual-write scenarios or stateless architectures
- If something is silently broken in Green, you discover it instantly at cutover (canary would catch it earlier)
Key knobs:
- Cutover policy (manual vs. auto with delay)
- Validation gates before promotion (e.g., smoke test pass rate, synthetic checks)
- Scale-down delay of old stack (how long to keep Blue warm before terminating it)
Important: Blue-Green deployments require careful handling of stateful systems. If your app writes to a shared database, ensure both Blue and Green can handle concurrent writes during switchover, or use feature flags to gate writes to the new version until you've completed the switchover and verified Green is stable.
Example (Argo Rollouts Blue-Green):
apiVersion: argoproj.io/v1alpha1
kind: Rollout
metadata:
  name: payments
spec:
  replicas: 12
  strategy:
    blueGreen:
      activeService: payments-stable
      previewService: payments-preview
      autoPromotionEnabled: false
      autoPromotionSeconds: 0
      scaleDownDelaySeconds: 600
      prePromotionAnalysis:
        templates:
          - templateName: pre-promotion-smoke-tests
        args:
          - name: service
            value: payments
  template:
    spec:
      containers:
        - name: app
          image: ghcr.io/org/payments:v5.4.0
The scaleDownDelaySeconds: 600 keeps the old Blue stack running for 10 minutes after cutover. If issues appear within that window, a rollback is instant. After 10 minutes, Blue is terminated and capacity is freed.
Failure Modes and Guardrails
These guardrails apply to all three strategies:
Schema drift: Use the expand-migrate-contract pattern for database changes. Expand the schema first, deploy code that reads and writes the new column alongside the old one, then contract by removing the old column in a follow-up release. This ensures both old and new code can coexist.
Cache or session churn: Version your cookies or use feature flags to invalidate old sessions during switchover. Better yet, use stateless JSON Web Tokens (JWTs) so cache eviction doesn't break user sessions mid-rollout.
Feature flags vs. releases: Feature flags gate behavior post-deploy (e.g., enable a new algorithm for 10% of users). Release strategies gate infrastructure (which version runs). Don't conflate the two. Use both: canary to gate infrastructure rollout, then feature flags to gate feature rollout within the new infrastructure.
Health illusions: A canary shows healthy latency metrics but real user logins fail because auth SLOs were not included in analysis templates. Always include user-journey checks (login, checkout, API calls) alongside infrastructure metrics (CPU, latency, error rate).
Noisy metrics: Use longer lookback windows (e.g., 3-5 minute aggregations instead of 30-second), robust thresholds (e.g., p99 latency < 400ms not < 100ms), and guard against insufficient traffic per step (minimum 100 requests per minute before analyzing). A step with 10 requests can have wildly swinging error rates.
Capacity cliffs: Reserve 30-40% surge capacity; cap concurrency limits on critical services; and limit horizontal pod autoscaler (HPA) aggression during rollouts (set max scale-up rate to 2x per 5 min, not 10x per 1 min).
At-a-Glance Comparison
| Strategy | Traffic Control | Capacity Overhead | Rollback Speed | Best For |
|---|---|---|---|---|
| Rolling (Gradual) | Implicit via LB | Low | Moderate (re-rollout) | Safe, backward-compatible changes |
| Canary | Weighted, stepped (%, duration, metrics) | Low-Medium | Fast (auto on breach) | Risky updates where metrics are decisive |
| Blue-Green | Binary flip | High (dual environment) | Instant (1 command) | Clean cutovers or compatibility breaks |
Operator Checklist: Main Settings You Control
All strategies:
- Health probes, PDBs, HPA min/max, surge buffers
- Observability: golden signals, SLOs, error budgets, distributed tracing
- Automated rollback policies and on-call escalation hooks
Rolling deployments:
- maxSurge, maxUnavailable
- Probe thresholds (failureThreshold, periodSeconds, initialDelaySeconds)
- minReadySeconds
Canary deployments:
- Step weights, pause durations
- Analysis templates (queries, success conditions, failure limits)
- Metric lookbacks (how much historical data to include in analysis)
- Abort gates and traffic router selection (Nginx, Istio, ALB)
- maxSurge, maxUnavailable
Blue-Green deployments:
- activeService, previewService
- autoPromotionEnabled, autoPromotionSeconds
- scaleDownDelaySeconds
- Pre-promotion smoke tests and validation templates
Migration Path: From Rolling to Canary
If you're already using Rolling deployments today, canary is a natural next step. You keep the same container images and deployment process. The difference: add a traffic router (Nginx ingress or service mesh), define SLO analysis templates, and configure traffic steps (e.g., 5% -> 25% -> 50% -> 100%). Most teams can migrate from Rolling to Canary in 2-4 weeks.
Putting It Together: A Pragmatic Release Train
A realistic release pipeline combines all three strategies:
- Build and validate: Run tests, static and dynamic application security testing (SAST/DAST), image scans, software bill of materials (SBOM), and policy checks.
- Staging validation: Deploy to staging, run smoke tests, shadow or proxy traffic from production to staging (for realistic load testing).
- Production canary: Deploy to 2% of traffic with SLO analysis gates. Promote to 10% if metrics pass. Continue to 25%, then 50%, with metric checks at each step. Auto-rollback if any SLO breaches.
- Full promotion or blue-green flip: For incompatible changes, skip gradual canary and go straight to blue-green for instant switchover.
- Post-promotion verification: Monitor stricter SLOs for 10-15 minutes after full rollout. Watch error budgets burn rate; if it's too high, trigger an automated alert or manual rollback.
As you can see, building a robust, progressive delivery pipeline involves a lot of complex configuration, metric integration, and YAML orchestration just to get started. Most teams spend weeks tuning analysis templates and thresholds.
One-Click Rollouts with Skyhook.io
Building this yourself means:
- Spending 3-4 weeks learning Argo Rollouts API, CRD semantics, and failure modes
- Writing and testing AnalysisTemplates for each service
- Integrating Prometheus, Datadog, or Kayenta manually
- Debugging YAML syntax errors and metric query mismatches
- Managing Nginx or Istio ingress rules by hand
- Training your team on rollout lifecycle and manual promotion
With Skyhook.io, powered by Argo Rollouts, teams don't have to hand-craft YAML every time:
- Choose strategy per service (Rolling, Canary, Blue-Green) from the UI in 30 seconds
- Pick traffic steps (weights and pauses) or use battle-tested presets from our library
- Attach AnalysisTemplates for Prometheus (or others) in one click
- Auto-rollback on SLO breaches and notify via Slack
- Preview and promote safely with audit trails showing who promoted what and when
- Abort or rollback live rollouts from the dashboard without touching kubectl
You focus on shipping fast; Skyhook handles the orchestration. If you're already on Kubernetes, adopting progressive delivery should be a one-click decision, not a three-month project.
Ready to ship without fire drills? Start a free trial on Skyhook.io today.